
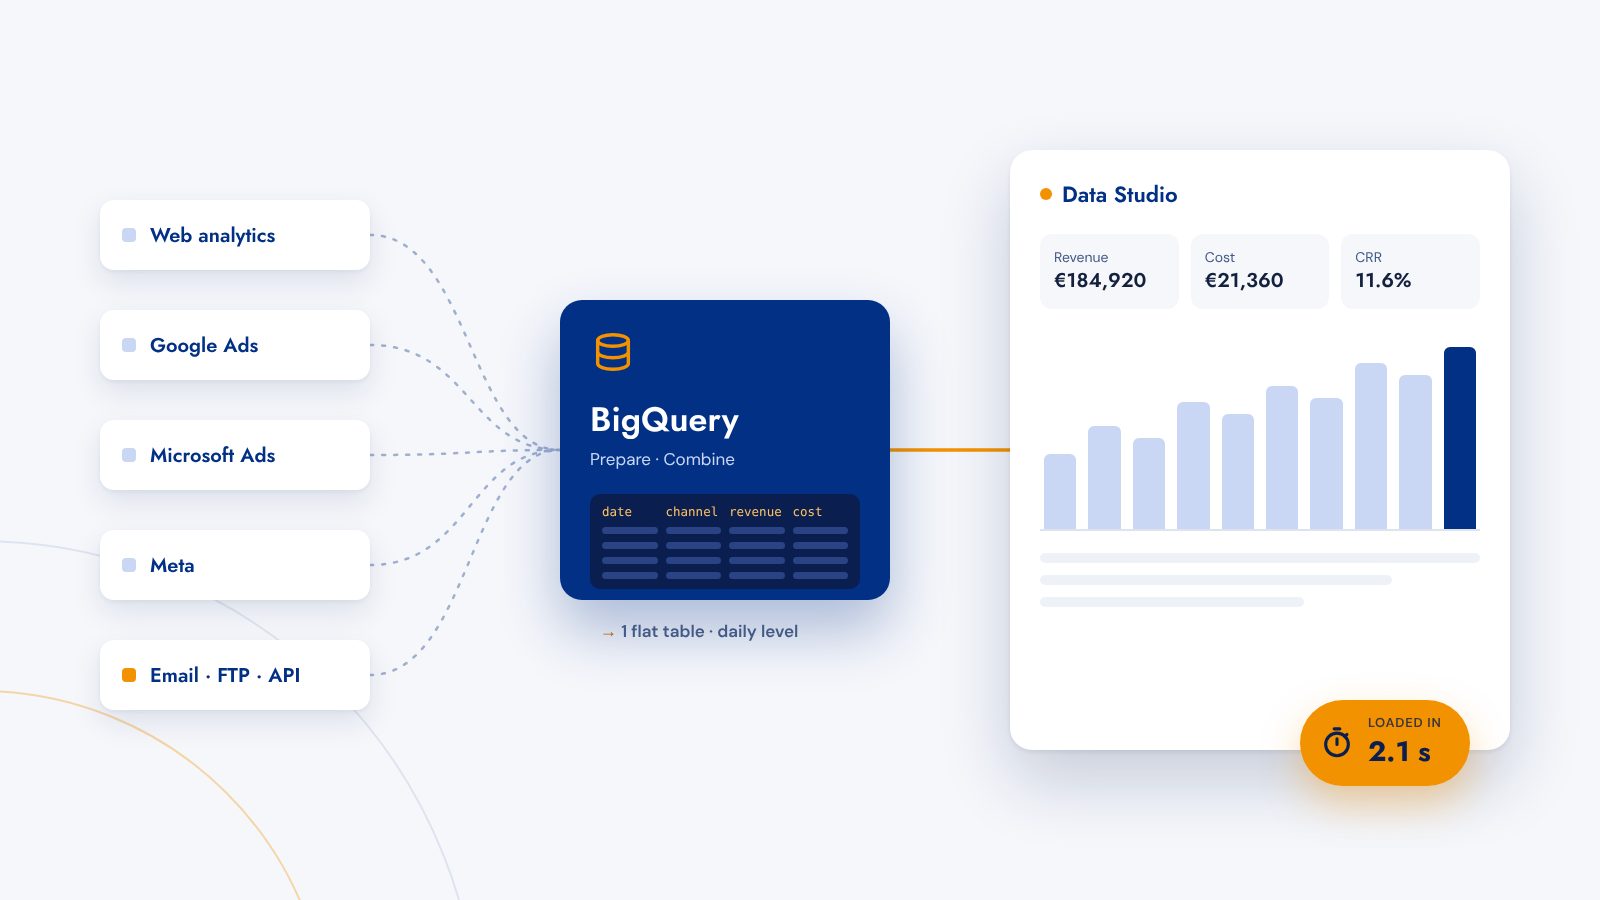
As complexity grows, Data Studio struggles and responds with long load times. A multichannel report can easily reach 110 charts and 48 filters across 13 pages. The renaming from Looker Studio back to Data Studio hasn't changed that. If you stare at spinning circles for ten seconds on every page change, you'll soon lose interest in reporting.
The good news: it can load in a few seconds, even with hundreds of thousands of products and millions of data points. Long load times mainly come from Data Studio having to join, aggregate and calculate the data itself. If you prepare the data in BigQuery beforehand, that step almost disappears.
What does an optimized data source look like?
The goal is one single, as flat as possible data source. Data Studio pulls the data for all charts and filters from it without first blending it with other sources or evaluating complex calculated fields.
So first decide which metrics you want to show and by which dimensions you want to filter or break them down. In our example:
- Metrics: sessions, orders, new customers, revenue, cost
- Calculated fields: conversion rate, cost-revenue ratio, new customer rate
- Dimensions: date, channel, sub-channel
To stay flexible with date ranges, comparison periods and weekly or monthly views, you need the data at daily level. The finished table then has these columns:
date | channel | sub_channel | sessions | orders | new_customers | revenue | costThe calculated fields are deliberately missing here; more on that later.
Where does the data come from?
Sessions, orders, new customers and revenue per date and campaign ideally come from your web analytics tool. Google Analytics 4 offers a free BigQuery export that writes the raw data to BigQuery daily. Alternatively, tools like Supermetrics fetch the data automatically and store it in a Google Sheet or directly in BigQuery.
Cost comes from the ad platforms. In our example, from Google Ads, Microsoft Advertising, Meta and three price comparison sites. For Google Ads there's the BigQuery Data Transfer Service; for the other major platforms, tools like Supermetrics. With the price comparison sites you'll probably have to improvise: the first sends its data as an email attachment, the second uploads it to your server via FTP and the third offers an API. This is where many people switch to manual work. We automate it with a small Bash script and Google Apps Script; details are in the appendix at the end.
Getting the data into shape
Later, cost needs to be matched to the right web analytics rows by date and campaign. Consistent campaign naming or end-to-end tracking with URL parameters helps here.
In our example, we use campaign codes defined by the client and appended to all campaigns as a URL parameter. Using these codes and a matching table, we clearly assign both cost and web analytics data to a channel and sub-channel. As an intermediate stage, there are three kinds of raw data:
Web analytics:     date | campaign_code | sessions | orders | new_customers | revenue
Cost per source:   date | campaign_code | cost
Matching table:    campaign_code | channel | sub_channel
Once the data looks like this, it's fairly easy to combine it into one flat data source with BigQuery.
Preparation
You need a Google Cloud project with BigQuery and a dataset in it, for example reporting. To try things out, the free BigQuery sandbox is enough. The overview of BigQuery analytics introduces queries in BigQuery.
Connecting Google Sheets data to BigQuery
Data that ends up in a Google Sheet is connected as an external table. In BigQuery, create a new table in your dataset:
- Source Drive, file format Google Sheets, plus the sheet URL.
- As the destination, a meaningful table name, for example
import_web_analytics. - Define the schema manually, with clear field names like
date,campaign_codeorsessionsand the right data types. This makes your SQL queries easier to read later. - Under advanced options, skip the sheet's header row.
Click "Create table" and the sheet is connected. Repeat this for every sheet.
BigQuery reads the data fresh from the sheet with every query, which slows things down with large volumes. So it's better to use the sheets as a staging area: a scheduled query regularly appends the new rows to an internal BigQuery table. This works very well for anything tools fetch automatically or that arrives in a fixed format.
Building the data source for Data Studio
With SQL you don't just combine the data, you can also convert or clean it along the way. A query across six cost sources and a matching table easily runs to more than 100 lines when cleanly formatted. This shortened version shows the principle:
CREATE OR REPLACE TABLE `project.reporting.report_data`
PARTITION BY date AS

WITH
cost_google AS (
  SELECT date, campaign_code, cost
  FROM `project.reporting.cost_google_ads`
),
cost_meta AS (
  -- The code is part of the campaign name, e.g. "Autumn Sale [K123]"
  SELECT
    date,
    REGEXP_EXTRACT(campaign, r'\[(K\d+)\]') AS campaign_code,
    spend AS cost
  FROM `project.reporting.cost_meta`
),
cost AS (
  SELECT * FROM cost_google
  UNION ALL
  SELECT * FROM cost_meta
),
rows_all AS (
  SELECT date, campaign_code, sessions, orders, new_customers, revenue, 0 AS cost
  FROM `project.reporting.web_analytics`
  UNION ALL
  SELECT date, campaign_code, 0, 0, 0, 0, cost
  FROM cost
)

SELECT
  r.date,
  IFNULL(m.channel, 'Unassigned') AS channel,
  IFNULL(m.sub_channel, 'Unassigned') AS sub_channel,
  SUM(r.sessions) AS sessions,
  SUM(r.orders) AS orders,
  SUM(r.new_customers) AS new_customers,
  SUM(r.revenue) AS revenue,
  SUM(r.cost) AS cost
FROM rows_all AS r
LEFT JOIN `project.reporting.campaign_matching` AS m
  ON r.campaign_code = m.campaign_code
GROUP BY date, channel, sub_channel
What happens here:
- WITH blocks bring every cost source into the same shape. This is especially useful when an important ID like the campaign code isn't a separate field but has to be pulled from a text field with
REGEXP_EXTRACT. - UNION ALL stacks web analytics rows and cost rows on top of each other, so neither cost without sessions nor sessions without cost gets lost.
- LEFT JOIN on the matching table assigns each code to a channel and sub-channel. Codes without a match show up visibly as "Unassigned" instead of quietly disappearing.
- GROUP BY condenses everything to one row per day, channel and sub-channel.
- PARTITION BY date splits the table by day. Data Studio usually queries a date range, so BigQuery only reads the partitions it needs. That's faster and cheaper.
Instead of CREATE OR REPLACE TABLE, you can also write the result to a destination table via the query settings in the BigQuery editor. Keep the table up to date with a scheduled query that runs daily.
Adding the data source to Data Studio
In Data Studio, add the table via "Add data" with the BigQuery connector: select the project, dataset and the report_data table. From here you build your report as usual, just without blended data sources and with much faster pages.
Create the calculated fields directly in the Data Studio data source, for example:
Conversion rate     = SUM(orders) / SUM(sessions)
Cost-revenue ratio  = SUM(cost) / SUM(revenue)
New customer rate   = SUM(new_customers) / SUM(orders)
Why not in SQL? Ratios can't simply be summed. If you calculate the conversion rate per day in BigQuery, Data Studio will quickly show a wrong average for a month. With SUM() in numerator and denominator, the value is correct for any date range and any filter.
Even more speed
If that's not enough, there are two more levers:
- Extract data: with the "Extract Data" connector, Data Studio caches a snapshot of the data itself (with a size limit) and refreshes it on a schedule. For compact, flat tables like ours, this is often the fastest option.
- BI Engine: BigQuery can keep data for Data Studio in memory. It costs extra but pays off with many users and large tables.
What you can count on
The benefit shows most in extensive reports. One of our projects consists of:
- 123 charts across 16 pages
- four optimized data sources, one of which feeds 110 charts and 48 filters on 13 pages
- 12 charts from two further data sources and a status table for the imports
The whole report uses only six calculated fields and not a single blended data source. Its pages load noticeably faster than a comparable report directly connected to Google Analytics and Google Ads.
Appendix: automating special cases
Some data can't be fetched with tools. Then there are two tasks: receive the data automatically and bring it into a uniform shape. What often makes it harder is that sources of the same kind arrive in completely different formats.
In our example, the first price comparison site emails daily cost including impressions and clicks. The second uploads a file with one row per click via FTP, without cost. The third offers a REST API for clicks per day, but without impressions. The end result should be a Google Sheet with this header:
date | provider | impressions | clicks | costWe use Google Apps Script for this because it works very easily with Gmail and Google Sheets. One variant reads email attachments from a dedicated reporting inbox, the other queries APIs. Both write to the shared sheet through the same function. A Bash script also sends the FTP files to the reporting inbox. You then connect the finished sheet to BigQuery as described above.
The following examples are deliberately lean. Adjust columns, separators and search terms to your sources.
Writing to the Google Sheet and avoiding duplicates
New rows are collected in output and written to the sheet in one go at the end. Before that, we check whether a row for that date and provider already exists.
const FILE_ID = 'YOUR-SHEET-ID';
const SHEET_NAME = 'cost_price_comparison';
const TIMEZONE = 'Europe/Berlin';
const output = [];
let existingKeys = null;

function addRow(date, provider, impressions, clicks, cost) {
  const key = date + '|' + provider;
  if (getExistingKeys().has(key)) {
    return;
  }
  existingKeys.add(key);
  output.push([date, provider, impressions, clicks, cost]);
}

function getExistingKeys() {
  if (existingKeys === null) {
    const sheet = SpreadsheetApp.openById(FILE_ID).getSheetByName(SHEET_NAME);
    const lastRow = sheet.getLastRow();
    const values = lastRow > 1 ? sheet.getRange(2, 1, lastRow - 1, 2).getDisplayValues() : [];
    existingKeys = new Set(values.map(row => row[0] + '|' + row[1]));
  }
  return existingKeys;
}

function writeData() {
  if (output.length === 0) {
    return;
  }
  const sheet = SpreadsheetApp.openById(FILE_ID).getSheetByName(SHEET_NAME);
  const range = sheet.getRange(sheet.getLastRow() + 1, 1, output.length, output[0].length);
  range.offset(0, 0, output.length, 1).setNumberFormat('yyyy-mm-dd');
  range.setValues(output);
}

function formatDate(date) {
  return Utilities.formatDate(date, TIMEZONE, 'yyyy-MM-dd');
}

function toNumber(value) {
  return parseFloat(String(value).replace(',', '.')) || 0;
}
Reading email attachments
The script searches for unread emails from a sender with an attachment, processes the CSV attachment and archives the thread so it doesn't come up again on the next run.
function readMailAttachments(provider, query) {
  const threads = GmailApp.search(query, 0, 20);
  for (const thread of threads) {
    const messages = thread.getMessages();
    const message = messages[messages.length - 1];
    const attachment = message.getAttachments({ includeInlineImages: false })[0];
    if (attachment) {
      processAttachment(provider, message.getDate(), attachment);
    }
    thread.moveToArchive();
  }
}

// Example: readMailAttachments('provider_a', 'from:report@provider-a.example has:attachment in:inbox');
Unifying different formats
Every source has its own format. A switch statement translates each into our uniform row.
function processAttachment(provider, mailDate, attachment) {
  const rows = Utilities.parseCsv(attachment.getDataAsString(), ';').slice(1);
  let date = formatDate(mailDate);
  let impressions = 0;
  let clicks = 0;
  let cost = 0;

  switch (provider) {
    case 'provider_a': // one row per campaign: impressions, clicks, cost in columns C to E
      for (const row of rows) {
        impressions += toNumber(row[2]);
        clicks += toNumber(row[3]);
        cost += toNumber(row[4]);
      }
      break;
    case 'provider_b': // one row per click, cost in column F, date in the file name
      date = attachment.getName().match(/(\d{4}-\d{2}-\d{2})/)[1];
      for (const row of rows) {
        if (row.length > 5) {
          clicks += 1;
          cost += toNumber(row[5]);
        }
      }
      break;
  }
  addRow(date, provider, impressions, clicks, cost);
}
Fetching data via a REST API
Using idealo, a German price comparison site, as an example: the script gets an access token and downloads yesterday's click report. Because the report contains no cost, we calculate it from the agreed cost per click. Credentials don't belong in the code but in the script properties (Project settings › Script properties).
function idealoMain() {
  const props = PropertiesService.getScriptProperties();
  const shopId = props.getProperty('IDEALO_SHOP_ID');
  const token = idealoGetAccessToken(props.getProperty('IDEALO_CLIENT_ID'), props.getProperty('IDEALO_CLIENT_SECRET'));
  const yesterday = formatDate(new Date(Date.now() - 24 * 60 * 60 * 1000));
  const cpc = 0.12; // agreed cost per click

  const report = idealoDownloadDailyClickReport(shopId, 'IDEALO_DE', yesterday, yesterday, token);
  for (const row of report.slice(1)) {
    if (!row[0]) {
      break;
    }
    const clicks = toNumber(row[1]);
    addRow(row[0].substring(0, 10), 'idealo', 0, clicks, clicks * cpc);
  }
  writeData();
}

function idealoGetAccessToken(clientId, clientSecret) {
  const response = UrlFetchApp.fetch('https://businessapi.idealo.com/api/v1/oauth/token', {
    method: 'post',
    headers: { Authorization: 'Basic ' + Utilities.base64Encode(clientId + ':' + clientSecret) },
    muteHttpExceptions: true,
  });
  return JSON.parse(response.getContentText()).access_token;
}

function idealoDownloadDailyClickReport(shopId, siteId, fromDate, toDate, token) {
  const url = 'https://businessapi.idealo.com/api/v1/shops/' + shopId +
    '/daily-click-reports/download?site=' + siteId + '&from=' + fromDate + '&to=' + toDate;
  const response = UrlFetchApp.fetch(url, {
    headers: { Authorization: 'Bearer ' + token },
    muteHttpExceptions: true,
  });
  return Utilities.parseCsv(response.getContentText(), ';');
}
Endpoints and report columns can change. Check them against the provider's current API documentation.
Workaround for FTP uploads
So that files received via FTP take the same route, a Bash script sends every new file as an attachment to the reporting inbox and then moves it to an archive. It runs permanently on the server and needs inotify-tools and mutt.
#!/bin/bash
WATCH_DIR="/path/to/ftp-upload"
ARCHIVE_DIR="/path/to/archive"
MAILTO="reporting@example.com"

inotifywait -m -r "$WATCH_DIR" -e create -e moved_to |
while read -r dir action file; do
  sleep 10 # wait until the upload is complete
  subdir="main"
  if [[ $dir =~ /([^/]*)/$ ]]; then
    subdir="${BASH_REMATCH[1]}"
  fi
  echo "File '$file' from '$subdir' received via FTP." |
    mutt -s "Reporting $subdir" -a "$dir$file" -- "$MAILTO"
  target="$ARCHIVE_DIR/$subdir/$(date +%Y%m%d)"
  mkdir -p "$target"
  mv -f "$dir$file" "$target/"
done
The archive deliberately sits outside the watched folder. Otherwise, the move itself would trigger another email.
Conclusion
Slow Data Studio reports are almost always a data problem, not a chart problem. If you move joining and preparing the data to BigQuery, Data Studio only gets one flat, daily table and hardly has to calculate anything. With scheduled queries, a few lines of Apps Script for the special cases and calculated fields in the right place, your reporting then runs largely by itself and loads in seconds.
This article was first published in German by adtraffic in 2022 and has been revised for rsc24. Code and recommendations were updated along the way.
First published at www.adtraffic.de